

Stock variance
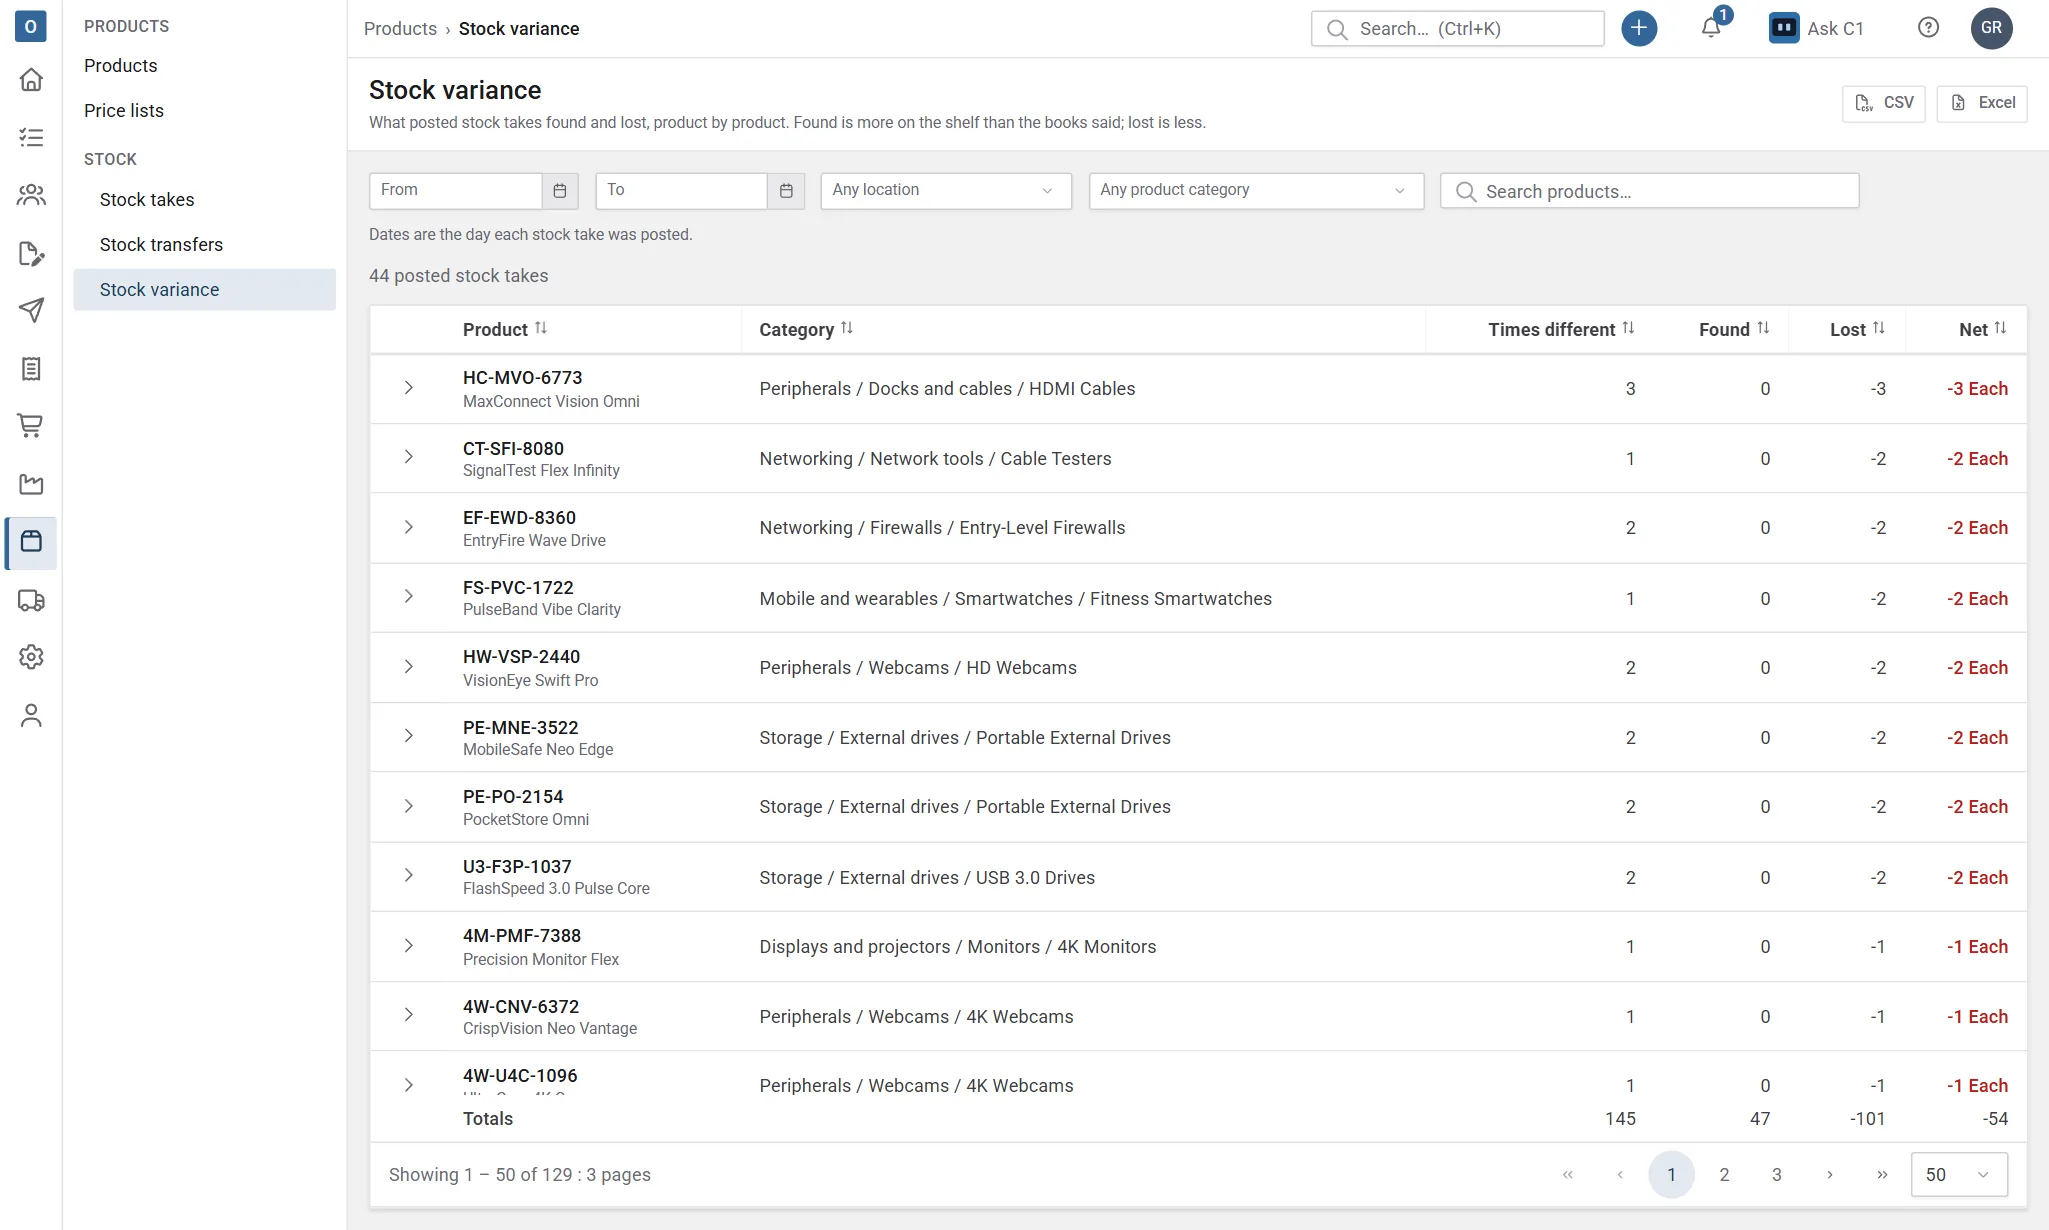
Products → Stock variance adds up what your posted stock takes found and lost, one row per product. Use it to see which products keep going missing, and what that’s worth. Anyone who can see stock takes can open it; the values need permission to see cost and margin.
The list
Section titled “The list”Each row is a product that a posted stock take counted differently from the books:
| Column | What |
|---|---|
| Times different | How many stock takes counted it differently from the books. |
| Found | How much more was on the shelf than the books said, added up. |
| Lost | How much less was on the shelf, added up (shown as a minus). |
| Net | Found and lost together. |
| Value found, Value lost, Net value | The same in money, at the cost each product had when its stock take was posted. Only if you can see costs. |
The products that lost the most come first: by net value if you can see costs, otherwise by quantity. Sort by any column, filter it with its filter icon, search by code, name or category, and select a product’s code to open its stock. Columns chooses your columns, including Description, Unit, Brand and Primary supplier, and Standard cost if you can see costs. A Totals row under the list, and the figures above it, add up the products listed, following your search.
Select the arrow beside a product to see the stock takes its differences came from: each one’s reference (select it to open the stock take), location, the day it was posted, the difference and its value.
Choose what’s added up
Section titled “Choose what’s added up”- From and To are the day each stock take was posted. A start after the end is highlighted, and nothing is looked up until it’s put right.
- Choose a location to see only the stock takes there.
- Choose a product category to see only its products. A category includes its sub-categories.
Only posted stock takes count. Stock takes still counting, or cancelled, have changed nothing, so they aren’t included.
Export
Section titled “Export”Export takes the list away as a CSV or Excel file: the products on show across all its pages, with your search, filters and sort, and the columns you’re showing. The Product column is the code: tick Description for the name. The totals aren’t in the file, and neither are blind counts or values you can’t see on the page.
Figures are numbers, so losses add up in a spreadsheet. Text that a spreadsheet could take for a formula (something starting with =, +, - or @) is kept as text.
To print what one stock take found and lost, use Print summary on its review.